
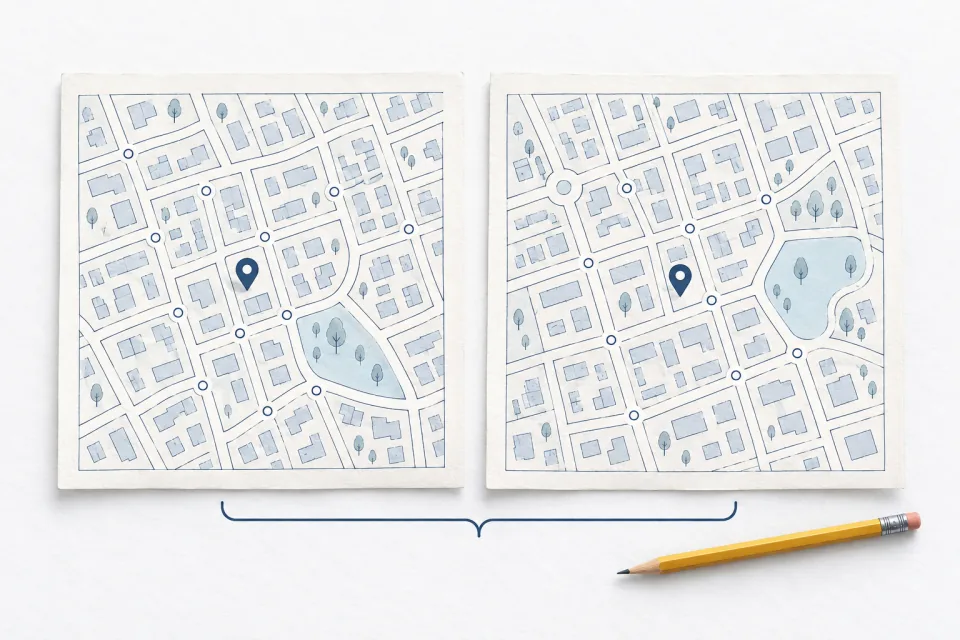
Editorial illustration
Decide what the comparison needs to answer
A local ranking comparison is only useful when its question is clear. Is the business becoming more visible for its main service? Does a new location reach the neighbourhoods it serves? Has a website page improved for a particular query? Those questions require different evidence. One overall ranking number conceals the distinctions.
Start by defining the business location, services, intended customer area and result surface. Separate a website's ordinary search result from a Business Profile in a local pack or Google Maps. Record which result is being measured and the exact profile or page identifier. A report about one surface should not silently stand in for another.
Then write the decision the comparison will support. “Decide whether the profile's service information needs investigation” is actionable. “See whether SEO is working” is too broad unless it also includes customer actions and enquiry outcomes.
Freeze a meaningful query set
Choose queries that represent the business's actual services and the way customers seek them. Keep brand searches separate. Distinguish a broad category, a specific service, an urgent need and a service paired with a place name. Those queries can reveal different competitive sets and customer intentions.
Record exact spelling and language. Do not replace a difficult query with an easier synonym between periods and describe the result as improvement. If the query set changes because the business changes, keep the old series and start a clearly labelled new one. A clean comparison needs a stable denominator.
Assign priority based on the business question, not the attractiveness of the chart. A service the business no longer offers should not dominate the report because it ranks well. Where demand evidence is unavailable, label a query as a chosen monitoring term rather than presenting it as a proven source of customers.
Use a repeatable geographic sample
Google says distance is one of its main local ranking factors, alongside relevance and prominence. Its local ranking documentation explains why a search near the business and one across the city can produce different results. A single manual check cannot describe that whole area.
For a geographic study, record the coordinates, spacing and boundary of the observation points. Choose them to represent the business's relevant customer area. Keep those same points for subsequent runs. If a new report expands the boundary, show it as a separate comparison rather than merging it into the old average.
A uniform grid can be useful for consistency, but its points do not automatically represent equal demand. A point over an industrial site or lake should not be interpreted as equivalent to a populated residential area. Describe any weighting as an analytical choice and explain its basis.
Keep collection conditions visible
Log the date, approximate time, device type, language, search location, result surface and collection method. For a tracking tool, retain the configuration and provider name. For a manual check, note the context and save enough evidence to understand the result later. A screenshot without a query or location is weak evidence.
Private browsing may reduce some history effects, but it does not remove the role of location, device and the moment of the search. Google notes these sources of variation in its Search Console performance guidance. Repeatability means making the conditions explicit, not pretending that every observer sees one universal page.
Avoid switching providers mid-series without a transition check. Tools may differ in result depth, location handling and how they identify businesses. If the method changes, compare overlapping observations and mark the break in the report.
Treat missing results as a separate state
If a business is not returned within a tool's checked depth, record “not observed within depth” and retain that depth. Do not translate it into a precise position you did not measure. Keep collection failure separate again: a timed-out query does not show that the business ranked poorly.
Before calculating anything, define an eligible observation: a completed check for a specified query, point and surface. Then keep counts for observed positions, results outside the checked depth and failed checks. If failed checks are numerous or concentrated in one part of the area, repair the collection before interpreting movement.
Be particularly careful with averages. Excluding all unobserved results can make a weak campaign appear strong. Assigning an arbitrary worst position can also distort the report. A visibility share with an explicit threshold and denominator often communicates the observation more honestly.
Report a distribution, not just an average
Useful summaries include the share of completed checks in a specified position band, the distribution of observed positions and coverage by neighbourhood. Define each band and keep it unchanged. A top-three share, for example, is the number of eligible checks observed in positions one to three divided by all completed eligible checks. Failed checks should be reported separately.
A local pack position and an organic position are different measurements even if both use small numbers. Do not combine them into one average. Report the important queries individually before showing an overall summary, so that a gain on a minor service does not conceal a decline on the main one.
Retain the underlying rows. A reader should be able to trace a headline percentage back to the query, point, date and observed business. Without that trail, a colourful map is difficult to challenge or use.
Use Search Console for its own question
Search Console provides evidence about the website's Google Search performance, including queries, pages, devices and countries. It is useful alongside a geographic ranking study, but it is not a coordinate-level Business Profile ranking grid. Use each source for the question it can answer.
Google defines average position using the topmost result for the property or grouping being measured, averaged over relevant impressions. Read the metric definitions before comparing the value with a manual search. A change in the mix of queries can move an aggregate even when a particular query-page pair is stable.
Compare matching query and page segments, date ranges, devices, countries and search types. Keep clicks and impressions beside position. Gaining impressions for additional lower-position queries can change the overall average without indicating that existing valuable queries have declined.
Explain changes before recommending work
Inspect which points and queries changed. Is movement concentrated close to the business, across one neighbourhood or on a single service? Did competitors change, did the business move, or did the observation method change? Keep a dated log of profile edits, website releases and operating changes to help frame the investigation.
Use language that matches the evidence. “More completed observations entered the chosen position band” describes a measured result. “The new photographs caused the gain” requires evidence a before-and-after chart alone cannot supply. Repeated measurements and stable conditions improve interpretation, but they do not eliminate every competing explanation.
End the report with a practical decision and its limits: investigate a mismatched service page, review location eligibility or keep observing an unstable pattern. Tie the ranking evidence to relevant visits and enquiries where those data are available. The purpose is a better decision, not the most dramatic colour change.
Put it into practice
- Define the decision, business identifier and result surface.
- Freeze exact queries and separate brand searches.
- Retain the same geographic sample and boundaries.
- Record collection conditions and provider settings.
- Separate outside-depth results from collection failures.
- Publish denominators and thresholds with summary metrics.
- Compare matching Search Console segments separately.
- Retain raw observations and a dated change log.
Open this guide’s interactive checklist
Sources & editorial note
- Local ranking factors
- Search Console performance setup
- Search Console impression and position definitions
Sources reviewed by the editorial desk on 30 October 2026.
Found a factual issue? Prepare a correction note through our editorial draft form. It saves on your device; delivery is not yet configured.